

In the world of clinical laboratories, where every drop counts and every number can change a life, facing uncertainty is an everyday occurrence. But what if I tell you that this uncertainty doesn’t have to be a headache?
ISO 15189 gives us the tools to turn it into our best ally. That’s right, that same uncertainty that makes us doubt is the one that, if well managed, can raise our standards of quality and trust.
Get ready! Because in this guide, I will not only help you meet the requirements of ISO 15189, but I will also provide you with essential tools to estimate measurement uncertainty, even for those much-feared qualitative methods.
Let’s get started!
What is Measurement Uncertainty in ISO 15189?

In ISO 15189, a set of requirements are established to ensure the quality and reliability of results obtained from laboratory tests.
These requirements include the much-mentioned estimation of measurement uncertainty.
But what is measurement uncertainty?
According to a formal definition, uncertainty can be conceived as a range of values associated with the result of a measurement where the true value can be found with a high probability.
In other words, measurement uncertainty is a concept created to deal with an inconvenience associated with measurements: we cannot know the true value exactly.
Why is Uncertainty Important in the Context of ISO 15189:2022?

Managing uncertainty is essential to ensure reliability in the results of clinical laboratory tests.
A measurement with high uncertainty can lead to erroneous decision-making in the diagnosis and treatment of patients.
This is one of the main reasons for estimating uncertainty.
Other benefits include:
- Improving the quality of the results obtained from laboratory tests.
- Increasing confidence in the results.
- Strengthening the laboratory’s reputation.
ISO 15189:2022 Standard Requirements for Uncertainty Management.
Clause 7.3.4 of the standard lists the requirements related to measurement uncertainty (referred to as MU within the standard). Here is what this clause explicitly states:
- The MU of the measured values must be evaluated and maintained for its intended use, where applicable. The MU must be compared with performance specifications and documented.
- MU evaluations must be reviewed regularly.
- For analytical procedures where MU evaluation is not possible or relevant, the justification for excluding MU estimation must be documented.
- Information about MU must be available to laboratory users upon request.
- When users inquire about MU, the laboratory’s response must consider other sources of uncertainty, such as biological variation, among others.
- If the qualitative result of an analysis is based on a test that produces quantitative output data and is specified as positive or negative, depending on a threshold value, the MU in the output value must be estimated using representative positive and negative samples.
- For analysis with qualitative results, the MU in intermediate measurement stages or the results of IQC (Internal Quality Control) that produce qualitative data should also be considered for key parts (high risk) of the process.
- MU should be considered when performing validation or verification of a method, where applicable.
What ISO 15189 tells us about uncertainty can be summarized as follows:
ISO 15189 highlights the importance of adequately managing Measurement Uncertainty (MU) in clinical laboratories. MU must be evaluated and regularly updated to ensure the reliability of results according to expected standards, documenting any discrepancies.
In cases where MU evaluation is not applicable, it must be clearly justified. Information about MU must be accessible to laboratory users, responding to their inquiries by considering all sources of variability, including biological.
Estimating MU is crucial in both qualitative and quantitative analyses, especially in those results that depend on threshold values. Moreover, MU plays a significant role in the validation and verification of analytical methods.
Methods for Evaluating Uncertainty in the Clinical Laboratory According to ISO 15189

In the clinical laboratory, there are two general groups of methods: quantitative methods and qualitative methods. Each has a distinct approach to estimating uncertainty.
We will address both approaches in a general manner. For this, we will first explain the uncertainty estimation approach for quantitative methods or the GUM method and then the approach for qualitative methods, or the approach based on Bayes’ theorem.
Estimation of Uncertainty for Quantitative Methods in Clinical Laboratories.
The estimation of uncertainty for quantitative methods in the clinical laboratory is achieved by implementing the uncertainty estimation protocol given in the GUM guide (Guide to the Expression of Uncertainty).
This guide summarizes the estimation of uncertainty in the following steps:
Step 1: Definition of the Measurand.
Before estimating the uncertainty of a quantitative method, provide a complete description of the measurand. In this description, you can include aspects such as the analyte to be measured, the matrix containing it, and its possible interferences.
Example: Determination of glucose in blood through the enzymatic technique by UV spectrophotometry.
During this description, you can also include related aspects: patient preparation, sample collection, and reagent preparation. That is, the preanalytical stages.
Step 2: Determination of the Measurement Model.
In this case, associate your measurement result with a measurement model that takes into account the input variables.
This measurement model relates the output magnitude (result of your assay) with the input magnitudes.
An input magnitude, in the case of the glucose test example, could be, for example, the measured absorbance.
This absorbance is multiplied by other output magnitudes to obtain the input magnitude or measurement result (glucose concentration expressed in mg/dL).
In other words, within this step, you obtain a measurement model where your output magnitude is a function of the input magnitudes, as indicated in the following equation:

Step 3: Identification of Uncertainty Sources.

Once you have the measurement model, proceed to identify the sources of uncertainty. Start by identifying the input magnitudes of your measurement model.
Each of the input magnitudes given in the measurement model is a source of uncertainty. These input magnitudes may in turn have secondary sources of uncertainty.
To properly identify sources of uncertainty, I recommend conducting a root cause analysis, Ishikawa diagram, or fishbone diagram.
This diagram allows you to identify, observe, and organize the sources of uncertainty in the measurement system.
The measurement system refers to all the elements involved in making a measurement. These elements are:
- Personnel.
- Environmental conditions.
- Supplies and reagents.
- Equipment.
- Environmental conditions.
Make sure to review each element of the system through the Ishikawa diagram. By doing so, you will be able to identify the sources of uncertainty.
During this process, it is advisable to involve personnel experienced in the method, as they know the possible intrinsic sources of uncertainty for each method.
Step 4: Quantification of the Sources of Uncertainty.
Once the sources of uncertainty have been identified, they must be quantified. To carry out this process, use the uncertainty estimation methods given in the GUM guide: uncertainty estimation by the Type A method or the Type B method.
Type A method: Refers to the estimation of uncertainty through statistical methods. For example, the collection of a series of data obtained under repeatability conditions and the determination of dispersion parameters such as standard deviation.
Once you obtain the standard deviation, apply the following formula to obtain the standard uncertainty value.
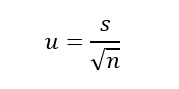
Where u is the standard uncertainty, s is the standard deviation, and n is the number of independent experiments conducted.
Type B method: Considers those methods in which statistical methods are not used to estimate the standard uncertainty. Among these methods are the use of reference material certificates, equipment calibration certificates, prior knowledge about the method, etc.
Once you have implemented one or both methods, you obtain the standard uncertainty values. These standard values are combined into a single expression. See it in the following step:
Step 4: Combining the Sources of Uncertainty.
After quantifying the sources of uncertainty and converting them into standard uncertainties, you proceed to combine them into a single result.
This single result is called combined uncertainty and is generally symbolized as uc
To calculate it, use a typical error expansion function like the following:
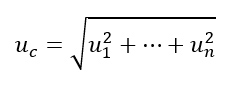
In this expression, un corresponds to each of the standard uncertainties from each source of uncertainty.
Step 5: Expansion of the Combined Uncertainty.
The next step after combining uncertainties is the expansion of the combined uncertainty.
The combined uncertainty, by itself, offers a low confidence probability for most applications in clinical analysis.
For this reason, its value is expanded to achieve a confidence probability of 95% or greater.
To do this, we take the value of the combined uncertainty and multiply it by a coverage factor k:
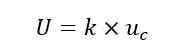
Where U is the expanded uncertainty, k is what we know as the coverage factor, and uc is the combined uncertainty.
The value of the coverage factor k is generally assumed to be 2. However, more detailed approaches demand its estimation based on the effective degrees of freedom.
Step 6: Expression of Uncertainty.
There are several ways to correctly express uncertainty, some examples are indicated below:
Example 1: Triglycerides (150 ± 20) mg/dL.
Example 2: Blood glucose 95 mg/L ± 5 mg/dL.
Example 3: Hematocrit 42% ± 2%.
One of the aspects to consider during this expression is the correct use of significant figures. As a general rule, the significant figures of the uncertainty should match the result or average value of the measurement.
Estimation of Uncertainty for Qualitative Methods in Clinical Laboratories.

Qualitative assay methods report dichotomous results, that is, outcomes such as “pass or fail” or “positive or negative.”
These qualitative results make it difficult to express measurement uncertainty in a manner similar to quantitative analysis.
Since typical measurement uncertainty is usually of a probabilistic nature, it is reasonable to express measurement uncertainty in qualitative analysis as the probability of making a wrong decision.
The Bayesian Method and Uncertainty in Clinical Testing.
To associate a probabilistic value with a qualitative measure, we can use the Bayesian approach. This approach is one of the oldest known methods when estimating uncertainty in qualitative methods in clinical laboratories.
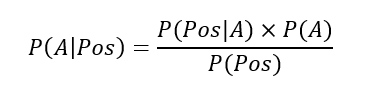
Bayes’ theorem is a concept related to conditional probabilities, where the probability of an event occurring is estimated given that an alternative event has already occurred.
The following example indicates two events:
– Event A: The event where the patient carries the hepatitis B virus.
– Event Pos: The event where the hepatitis B surface antigen test (HBsAg) turns out positive.
Using the Bayesian approach, we could estimate the probability that the patient is sick given that the test result was positive. We achieve this by using a conditional probability equation like the following:
Likelihood Ratios for Estimating Uncertainty in Clinical Laboratories.
There are several approaches we can take when trying to obtain the probabilities given in the previous equation.
One of these approaches, within Bayes’ theorem, is the calculation of likelihood ratios. These ratios are obtained through the following expressions:
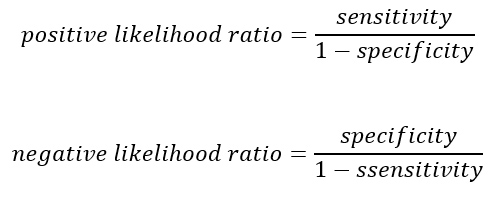
As you can see in the previous expressions, the likelihood ratio can be positive or negative. Each of them compares two conditional probabilities. Observe with the following statements:
The positive likelihood ratio compares the probability that the laboratory test result is positive given that the person is actually sick versus the probability that the result is positive given that the person is not sick.
Whereas the negative likelihood ratio represents the probability that the result is negative given that the person is not sick versus the probability that the result is negative given that the person is indeed sick.
To estimate each of these ratios, it is necessary to previously know the terms sensitivity and specificity.
Sensitivity refers to the test’s ability to detect patients who have the disease. On the other hand, specificity is the ability of the test to identify healthy patients.
These terms correspond to the performance parameters of a clinical laboratory test. They can be determined from previously published reports for technical specifications of the assays.
Considerations About Bayes’ Theorem for Estimating Uncertainty in Clinical Tests.
- One of the main advantages of Bayes’ theorem is that it allows for the simple quantification of uncertainty once the prior probabilities of sensitivity and specificity are known.
- The uncertainty calculated with this method is the measurement uncertainty for the measurement system, not for an individual measurement.
- The approach usually requires many repeated measures to determine the values of sensitivity and specificity.
In Conclusion
And there you have it, dancing with uncertainty doesn’t have to be a stumble in your everyday lab work.
Through this journey, I hope you’ve found that spark of confidence to face uncertainty head-on, not as an obstacle but as a step further towards excellence.
ISO 15189 sets the pace, but it’s you and your team who put the music and style in this dance.
So, let’s get to work! Turn that uncertainty into your secret superpower. We’re in this dance together, and together we can make every result count, with confidence and quality.